Every Neuron
The complete nervous system of a male fruit fly, 166,000 neurons and 125 million synapses, was published in Cell in September 2026. Every Neuron puts that map in the browser, and not one of the 22,691 cells on screen is a drawing. Every fibre is data. It does not show a loading bar either. It draws the cells in front of you, the counter climbing from 578 to 22,691 with a label saying whether it is on the motor neurons or the nerve cord. 
Visit site ↗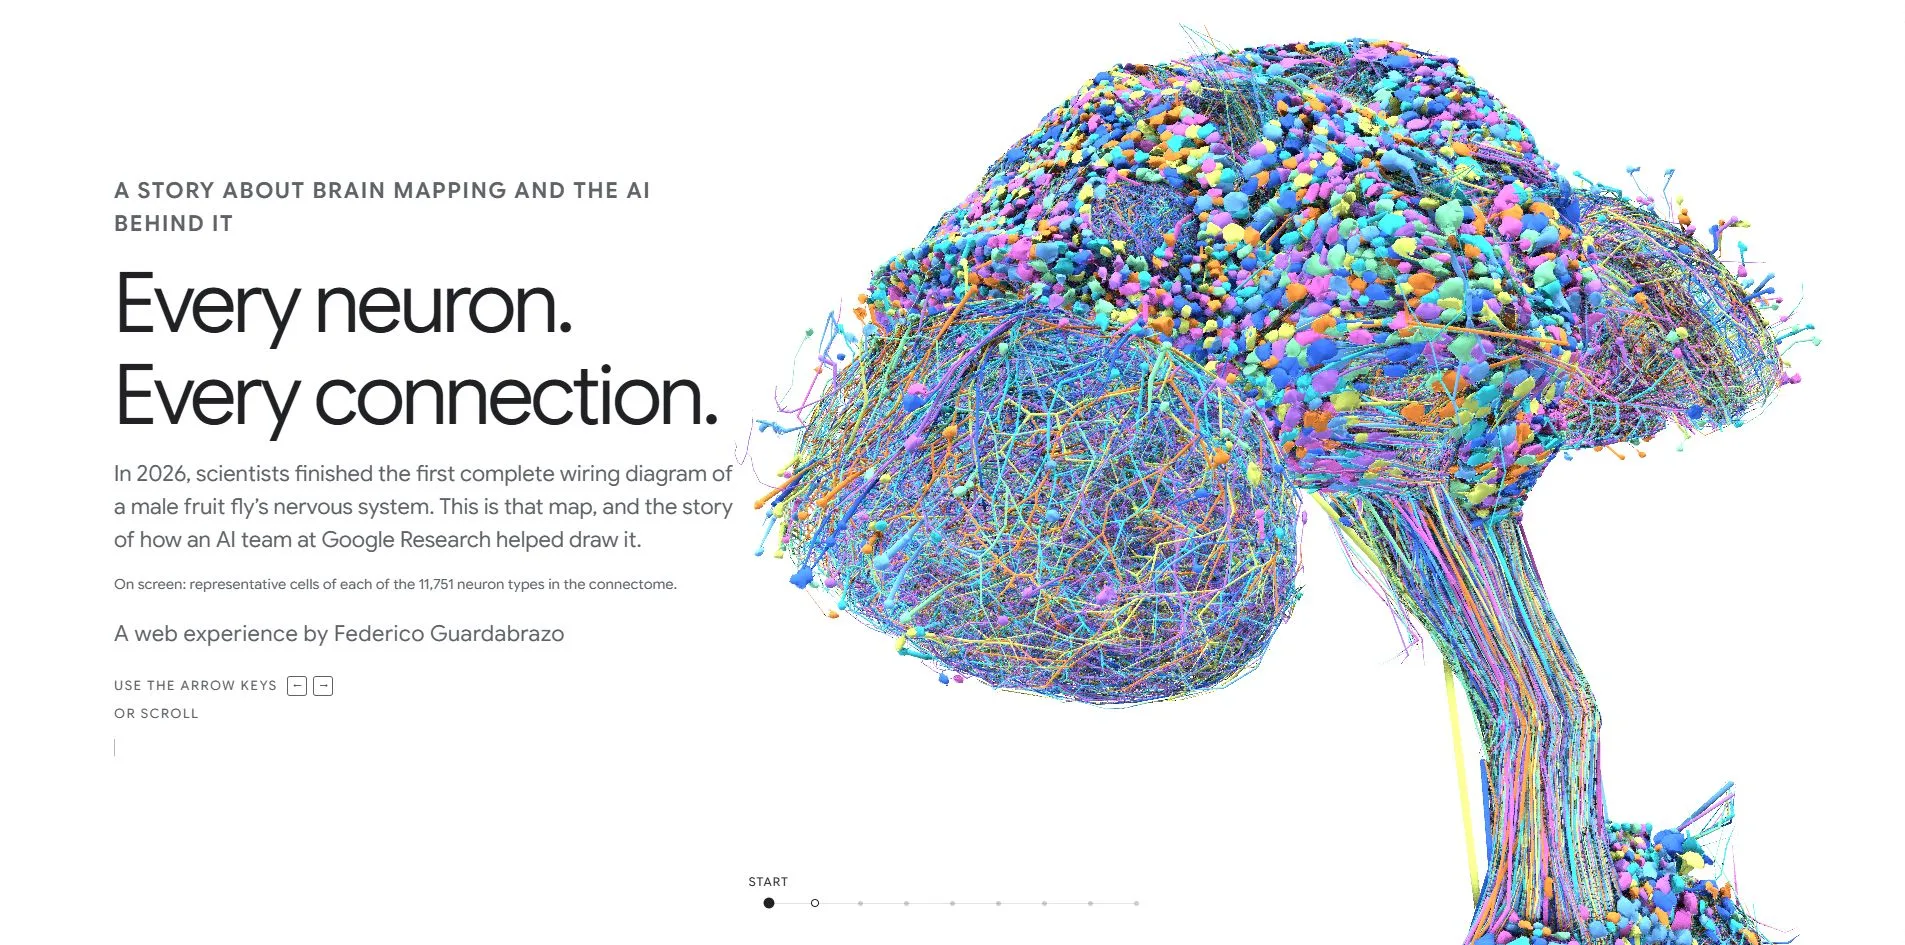
Concept
This is a personal project by Federico Guardabrazo, a creative technologist in Madrid, about how Google Research's connectomics team helped HHMI Janelia draw the first complete wiring diagram of a male fly's nervous system. The credits page states that it is independent, unaffiliated with Google or Janelia, and built on the public CC-BY release.
The usual way to explain a result like this is to commission illustrations. This site sets the opposite rule. No illustration appears anywhere. A Python pipeline pulls skeletons, meshes, synapse positions and one electron-microscope slice out of the public data, and three.js renders them in the browser. So the blue single cell DNa01 is that cell's real shape, the 275 purple LC10a cells are 275 real cells, and every dot on the 13 yellow DA1 projection neurons is a real synapse, 59,597 inputs and 15,129 outputs.
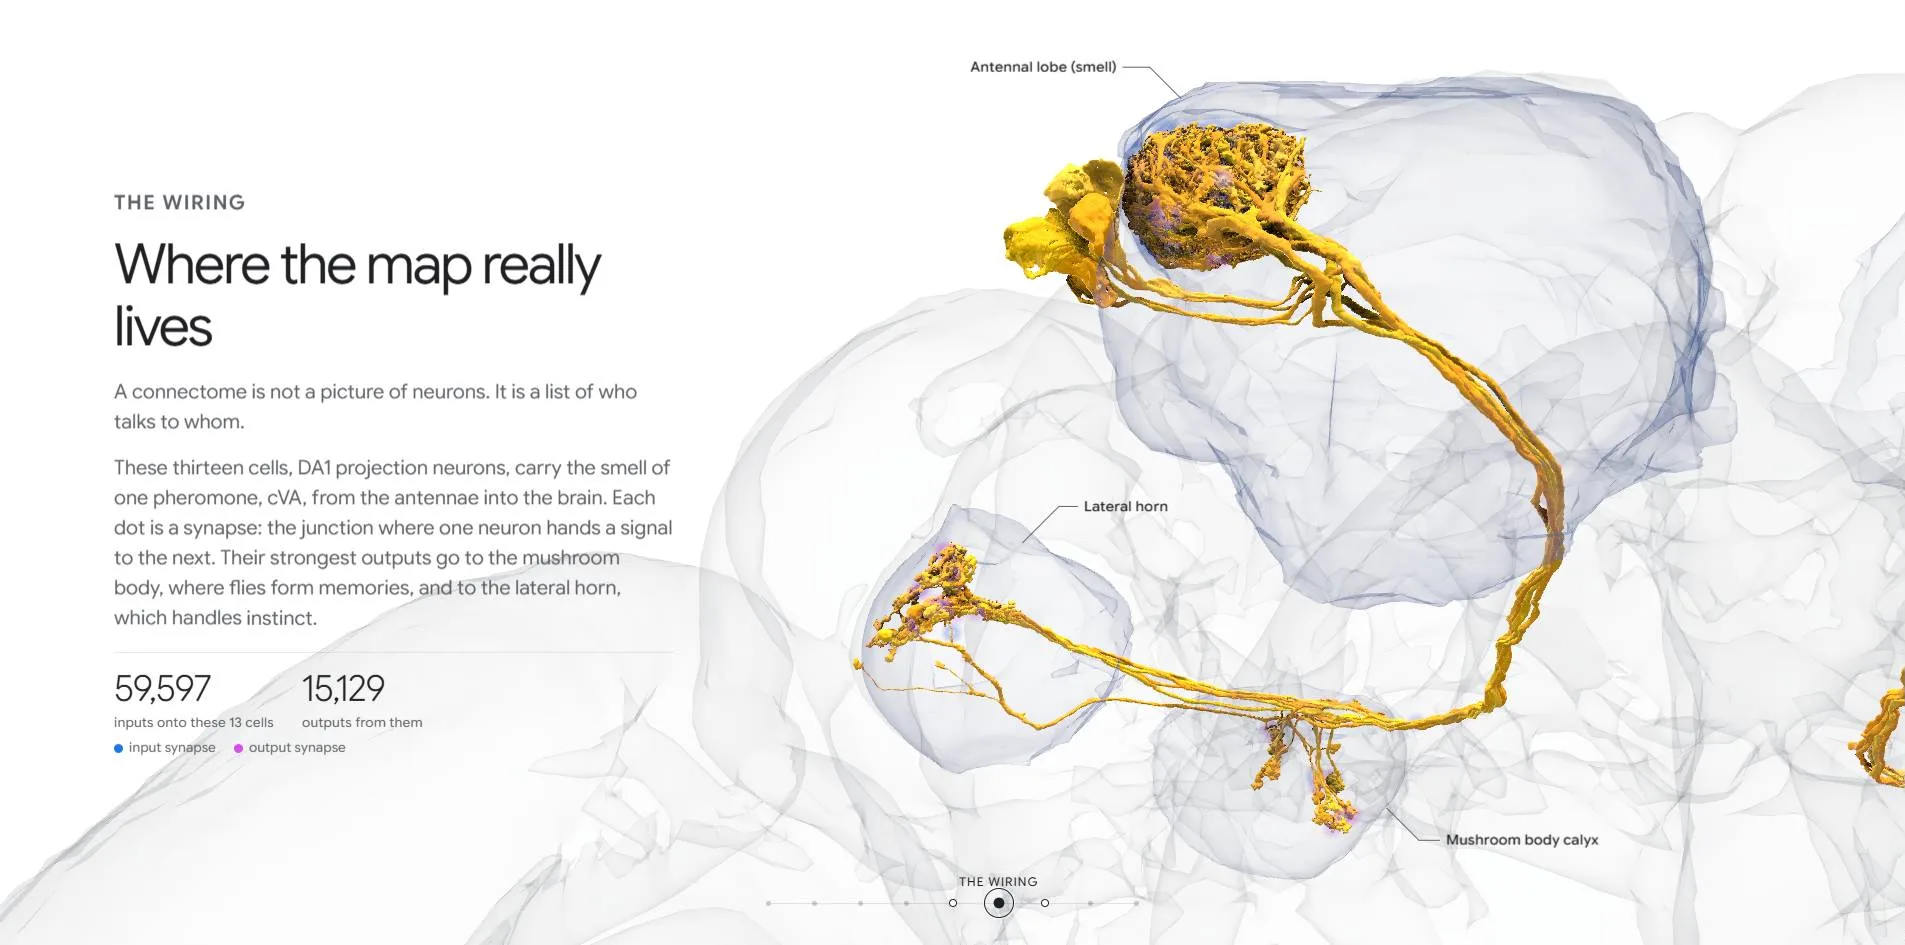
The story runs in nine beats. The whole map, then one cell, then that cell's journey from the brain down into the leg circuits, then 275 copies of one type, then the wiring of a pheromone circuit, then why a male was chosen, then how it was made, then the mouse brain that comes next. Each beat is a camera flight, the text switches sides, and only the cells that matter to that beat stay in colour while the rest fade to translucent grey outlines.
In the chapter on method, the thing on screen is a real microscope slice at 8 nanometres per pixel with the AI's segmentation colouring laid over it. That chapter is longer than any other, and scrolling turns the slice over layer by layer, because the raw data was a stack of slices to begin with.
When the story ends the page hands you the dataset. Open the explorer opens a free viewer with 12 cell groups you can switch on and off, two colour modes, five preset vantage points, drag to orbit, scroll to zoom, and a click on any cell to single it out and name its type.
Design
The site uses one typeface, Google Sans Flex, a variable font from weight 300 to 700. The headline is 84px at weight 400 with tracking pulled in to -2.52px. Chapter titles are 56px at -1.68px. Body text is 19px on a 28.5px line in the mid grey rgb(95, 99, 104), headings in the near-black rgb(32, 33, 36). Each chapter opens with a small all-caps kicker at 22px, weight 600, tracked out to 1.76px, ONE CELL, THE WIRING, HOW IT WAS MADE. The statistics are 36px at weight 300, thinner than the headings and larger than the body, 166,000, 125 million, 275, 262, 114, each with a line of small text underneath saying what it counts.
The page is pure white and the text has two greys. Colour is reserved entirely for the data. The full map uses a pastel palette assigned per cell type, blue, cyan, purple, orange and yellow packed together so that from a distance it reads like a mound of sugar crystals. Inside a chapter the palette collapses to a single saturated colour, blue for DNa01, purple for LC10a, yellow for DA1, blue and magenta dots for synapses, with every other cell dropped to a translucent grey shell. In the explorer the By group mode switches to 12 functional colours, deep blue for the central brain, green for the nerve cord, orange for descending neurons, magenta for motor neurons.
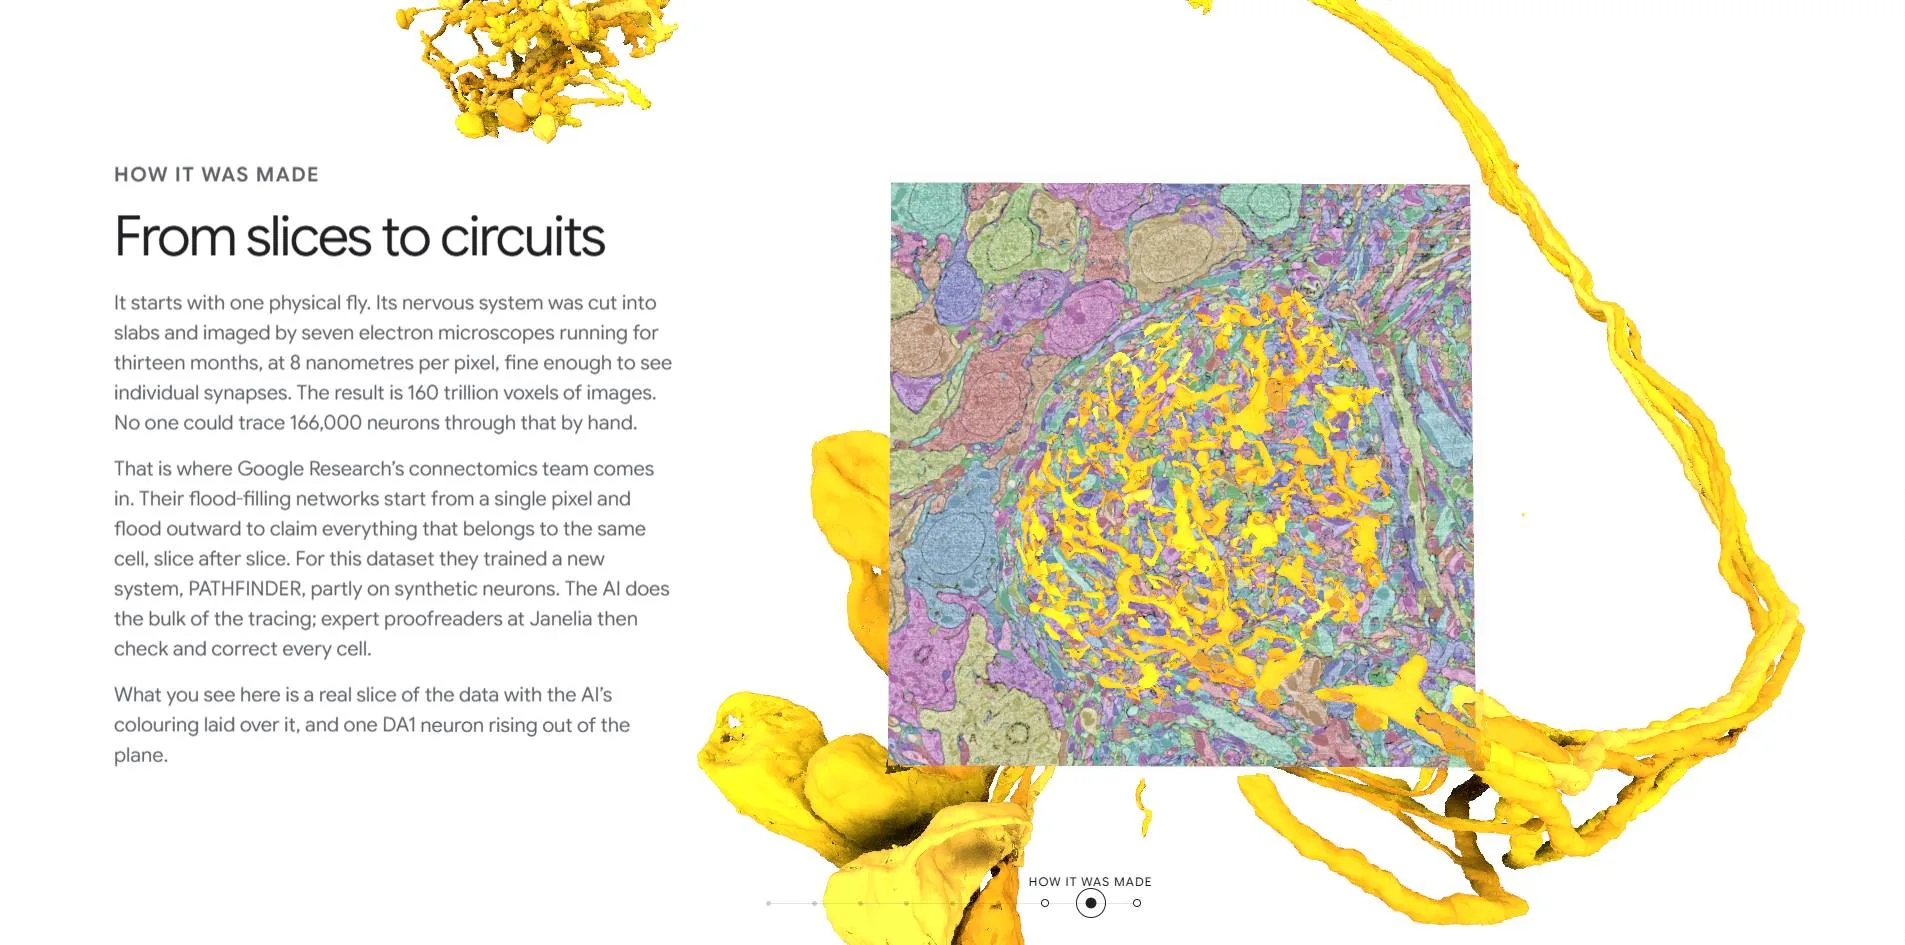
The layout alternates between two columns. The 3D scene is pinned to a full-screen canvas, and the text cards are 560px wide, one chapter sitting at the left edge at 114px, the next at the right at 1,231px. The cards have no background. Text sits directly on the white with the 3D behind it. Of the nine beats five sit left, two sit right, and the first and last sit left and wider. Every chapter change therefore comes with a clear shift of the eye. Wherever the camera flies, the text gets out of its way.
Annotations use thin leader lines. Brain, Optic lobe and Ventral nerve cord each get a bent line pointing at the structure, with a 1 mm scale bar beside them. In the leg circuits the labels become Front leg circuits, Middle leg circuits and Hind leg circuits. In the smell circuit they become Antennal lobe, Lateral horn and Mushroom body calyx. The labels track the 3D structures, like the leader lines on an anatomy plate.
The fine craft is in the cursor and the progress bar. The cursor is replaced with a 14px ring with a 1px stroke, almost invisible on white, present only to tell you when there is something to click. Nine dots along the bottom mark the beats, the name of the current one floating above its dot, the ones already visited filled in.
The form, a pinned graphic with alternating text cards, is an established pattern from news visualisation. What sets this apart is the refusal to illustrate. Sites explaining this kind of science simplify it into diagrams. This one hands 4.4 million tube segments straight to the GPU and lets the real data stand in for the picture. Take that rule away and what remains is a well-set long read.
Motion
There is no smooth-scroll library. Scrolling is native. The story advances in beats, and the left and right arrow keys, PageDown and the space bar all turn the page, the camera flying to the next beat while the scroll position eases from 1,408 to 2,478 pixels over a little more than a second. The wheel works too, and the camera follows scroll position continuously.
The text in each beat does not appear as a block. All 722 words on the page are wrapped in their own span and fade in line by line, and screenshots often catch a paragraph with its top half sharp and its bottom half still pale grey.
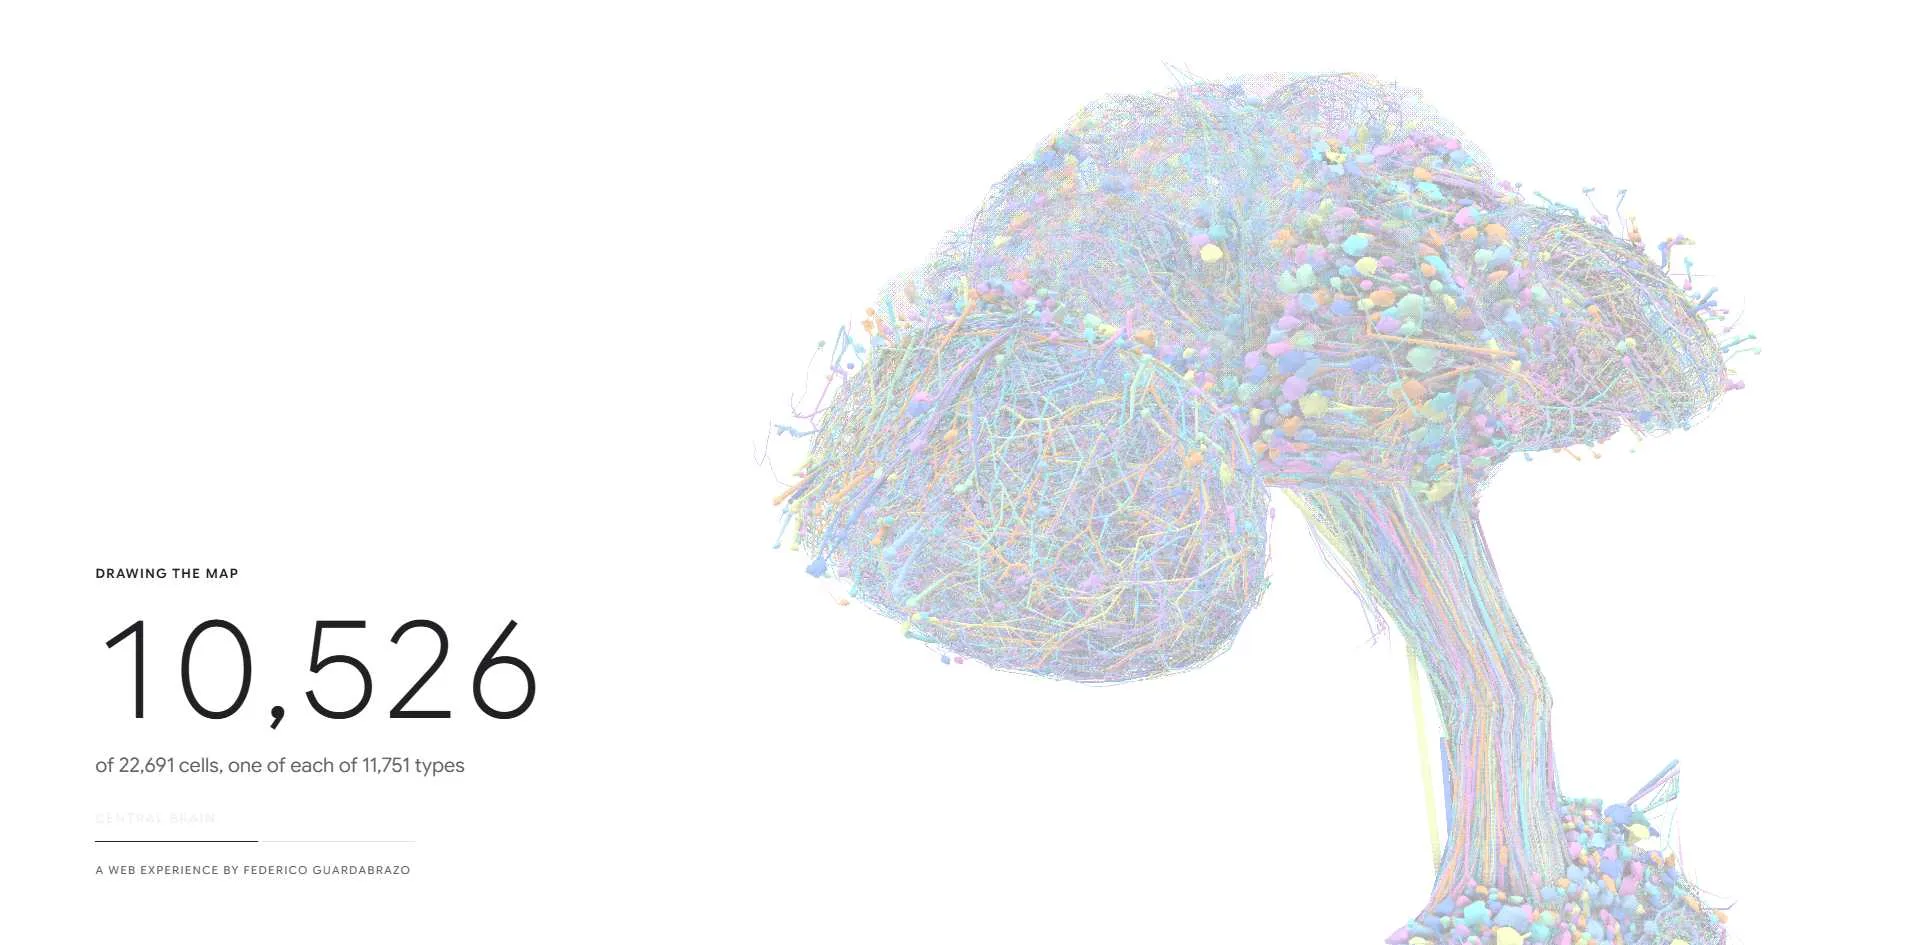
Loading is the first animation. Once the page opens the cells are drawn in batches by region, the counter at the bottom left climbing from 578 to 7,464 to 10,526 while the label reads MOTOR NEURONS, then NERVE CORD, then CENTRAL BRAIN. Drawing everything takes five to six seconds, and only then does the headline fade in.
At a chapter change the unrelated cells do not vanish. They dim to translucent grey shells, the camera pushes in on the target structure, and the leader-line labels appear with it. Across the nine beats the frame rate holds at 60 during the flights, with the worst single frame at 34ms.
The chapter on method is a microscope stack you can scrub. The arrow key has to be pressed seventeen times to get through it, and each press turns the slice plane over one layer, nine slice images replacing each other while the yellow DA1 neuron keeps rising out of the plane.
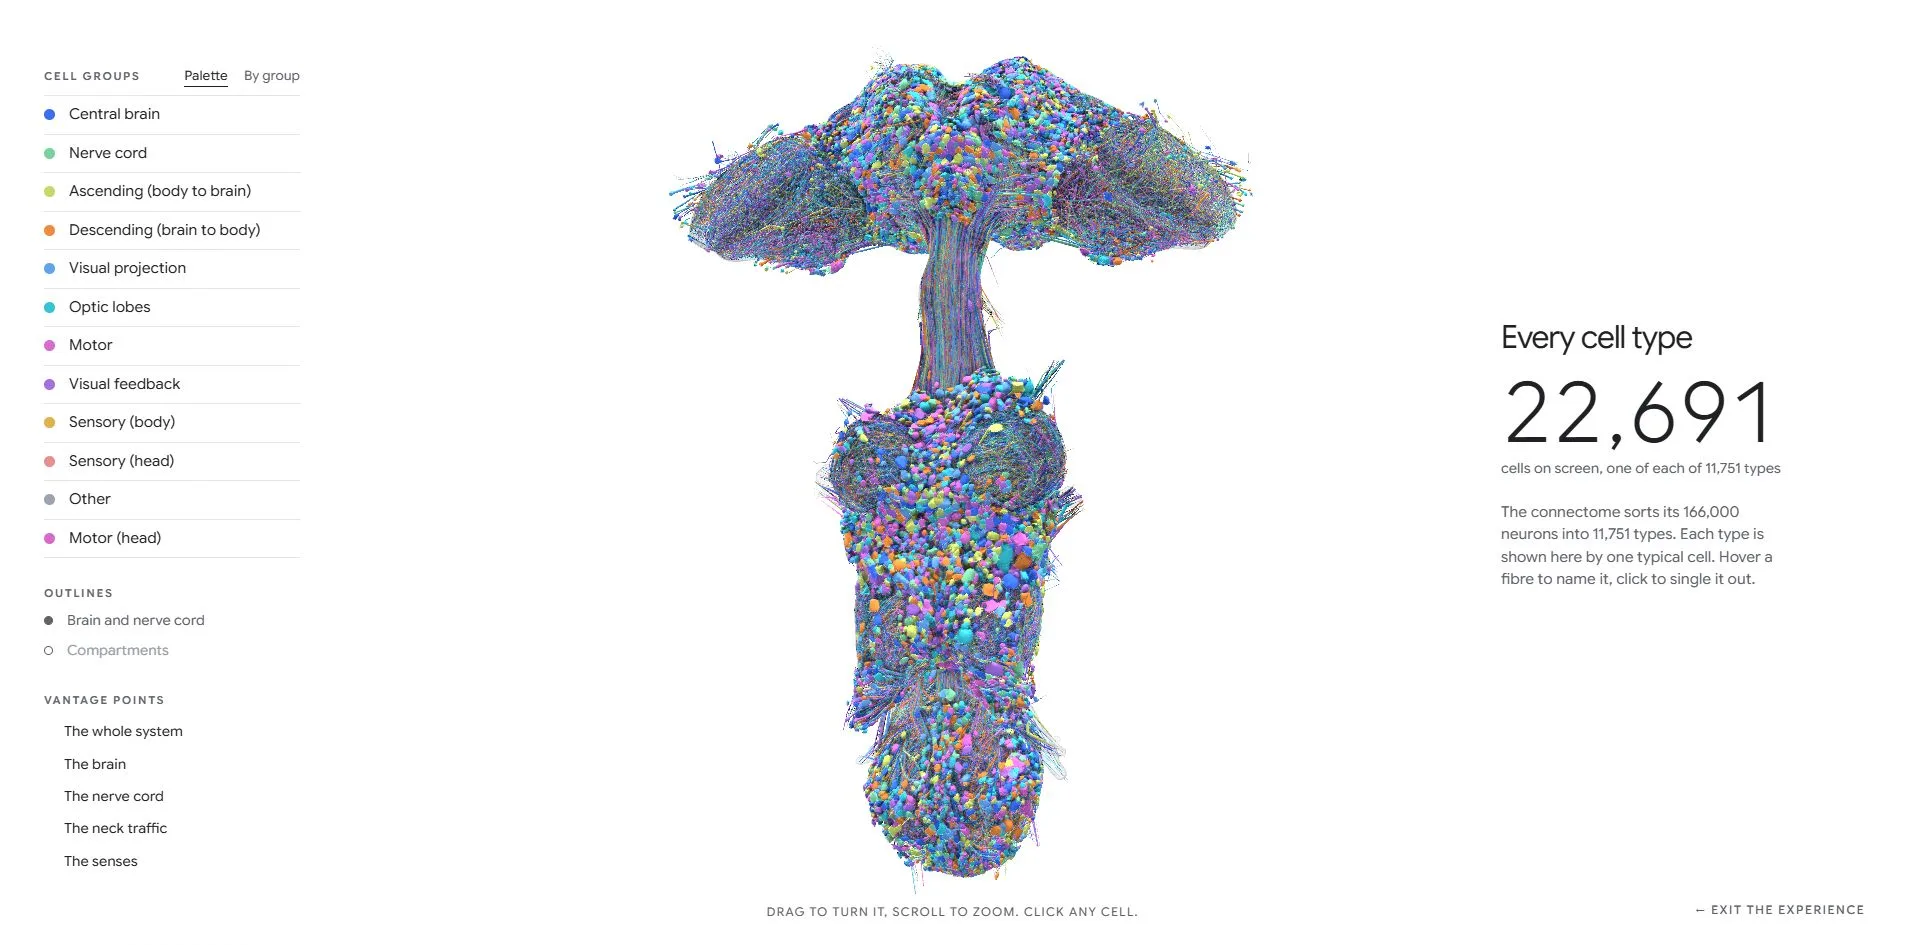
In the explorer the cursor becomes a grab hand. Drag to orbit, scroll to zoom, with an OrbitControls damping factor of 0.05. The left panel is 340px wide, the 12 cell groups are buttons with the switch role, and turning one off drops the count on the right immediately from 22,691, down to 13,027 with only the central brain left. Click any fibre and that cell is singled out, with a readout on the right such as SLP126 Central brain right side giving its type and position. The five vantage points are each a camera flight, the whole system, the brain, the nerve cord, the neck traffic and the senses. Orbiting and zooming both hold 60 fps.
Engineering
The site is a static Vite build with three scripts, 57 KB for the story, 697 KB for the explorer with three.js r185 inside it, and a wrapper for the Draco decoder. Everything lives in one HTML file with no framework.
The data is the bulk of the site. Opening the home page downloads 52.9 MB, all of it requested in a single burst 1.45 seconds after parsing begins, and nothing else is ever requested, not even at the bottom of the page. Of that, 29.5 MB is 13 gzip-compressed tube geometry files split by cell class, two files for the central brain's intrinsic neurons at 7.9 MB and 7.1 MB, the nerve cord at 6.1 MB, descending neurons at 2.4 MB, ascending at 2.1 MB. The browser decodes the gzip with DecompressionStream, after reading the first two bytes of each file to confirm the magic number. The cell bodies are 11 Draco files totalling 4.8 MB, and the 9 brain-region shells are Draco too, 405 KB altogether. The high-detail meshes for the three featured cells come to 6.2 MB, and the 74,726 synapse positions for DA1 to 1.1 MB. The microscope part is a 2.8 MB slice plus 9 stack images at 5.4 MB. The tubes finish downloading inside 4 seconds, the microscope images by 8.9 seconds.
On the GPU that data becomes 278.5 MB of vertex buffers. The first frame draws 12.04 million triangles in 29 draw calls, with the 22,691 cells merged into one batch of geometry per cell class, one call each, and the shells on top. Single-cell chapters drop to 8 calls and 830 thousand triangles. The explorer runs at 32 calls and 12.14 million triangles, peaking at 54 calls and 24 million during an orbit. Under that load the frame rate stays at 60 throughout, with a p95 frame time of 17ms.
On timing, the first byte arrives in 94 to 106ms and first contentful paint lands at 312 to 324ms on the loading counter. The body switches from loading-locked to ready between 5.2 and 6.0 seconds, and the headline appears only after that, so largest contentful paint is recorded at 5.2 to 5.3 seconds. Loading produces 10 long tasks, the longest 727 to 832ms, which is the geometry decode. Layout shift is 0.0001. The JS heap settles at 317 MB.
Continuous scrolling averages 58 fps over the whole page, dipping to 53 fps through The map with a p95 of 33ms, and one 224ms frame in the microscope stack. Singling out a cell uses GPU picking, rendering the scene as ids and reading the pixel back with readPixels.
Accessibility is complete. The page declares English, has header, nav, main and footer landmarks, one H1 followed by eight H2s and three H3s, and all 29 controls are named. The explorer switches carry aria-checked with the switch role, and both the rows and the mode buttons have focus-visible styles. The reduced-motion preference is honoured in three places, the panel rows, the loading groups and the line-by-line text. The one image has alt text. The arrow keys, PageDown, space and PageUp all map to turning the page.
Scores and Team
| Award | Source | Date | Score |
|---|---|---|---|
| FWA of the Day | The FWA | 2026-09-20 | 81 POINTS, DAYS 14 |
The FWA gives a single score, and 81 sits at the bottom of the 81 to 84 range where winners usually land. The team's description rests its case on three things, 22,691 real cells rendered live in the browser, no illustration anywhere, and an explorer that hands over the whole map once the story is done. Measurement agrees with all three. The browser really is drawing twelve million triangles a frame, and there is no diagram to be found on the page.
| Credit | Identity | FWA record |
|---|---|---|
| Federico Guardabrazo | Madrid, Creative Director and senior Creative Technologist at SpecialGuestX, new media artist, lecturer in creative coding | 1, this site |
His profile describes his work as translating complex systems into public visual experiences, with Google, DeepMind and Meta among the clients. This site is about a Google Research result, but its credits page states plainly that it is an independent project, unaffiliated with Google, HHMI Janelia or the paper's authors. The data comes from the public MaleCNS v1.0 release through neuPrint and navis, and the neuron shapes are the released segmentation meshes at reduced detail. It is his first FWA, and the site has not won on Awwwards.
Archive
- Award date
- 2026-09-20
- Awards
- The FWA FOTD 2026-09-20
- Site
- https://www.everyneuron.com/
- Credits
- Federico Guardabrazo
- Design
- cinematic
- Build
- scroll
- The FWA
- 81 POINTS, DAYS 14. https://thefwa.com/cases/every-neuron
- Stack
- Vite, three.js r185, WebGL2, Draco, DecompressionStream, OrbitControls, Google Sans Flex, Cloudflare
- Total assets
- 52.9 MB, all downloaded at open, 29.5 MB of it 13 gzip tube-geometry files
- Speed
- FCP 312 to 324ms, LCP 5.2 to 5.3s, CLS 0.0001. Continuous scroll 58 fps, explorer 60 fps