Lidar Drone Scanning
Lidar Drone Scanning is the official website of a drone that does not exist. The Polish studio Riotters invented a LiDAR inspection drone brand called Aevion, then built its site the way real product sites are built, from the hovering drone and the spec sheet all the way to the data software. The most convincing part comes at the end, a 3D terrain map where a visitor clicks a point, the camera flies to it and a panel with a risk level and a confidence score opens, like a real inspection report.
The footer says this is a Riotters tech demo. It won Site of the Day on Awwwards and had already won FWA of the Day.
01Concept
Riotters made this site to show that it can explain a complicated piece of hardware clearly. The studio's FWA introduction is a single line, your product is complex, we make it obvious. The top of the site reads Tech Demo By Riotters, and the footer calls the website a tech demo, asking whether visitors want something similar. A line of small print adds that this is a non-commercial technology demo with no connection to DJI. The Aevion brand and its drone are therefore made up, while the specifications follow a real DJI LiDAR device, and the copy says the drone is engineered around the DJI Zenmuse L2 LiDAR payload.
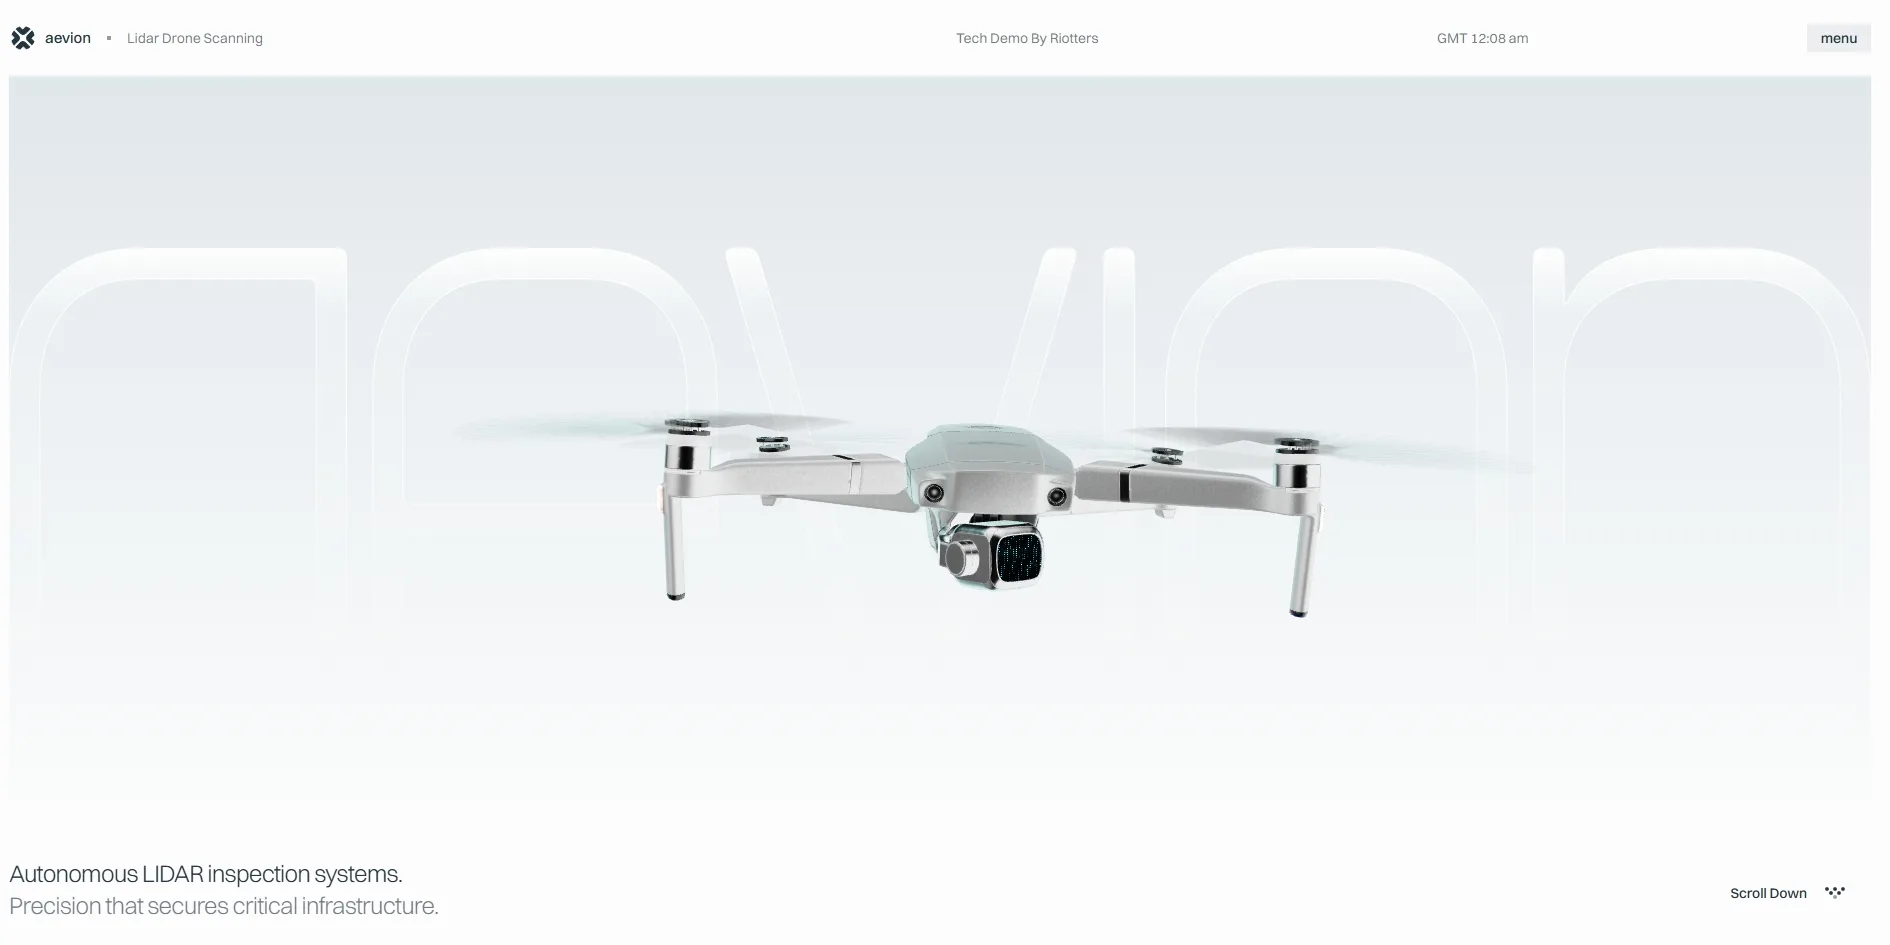
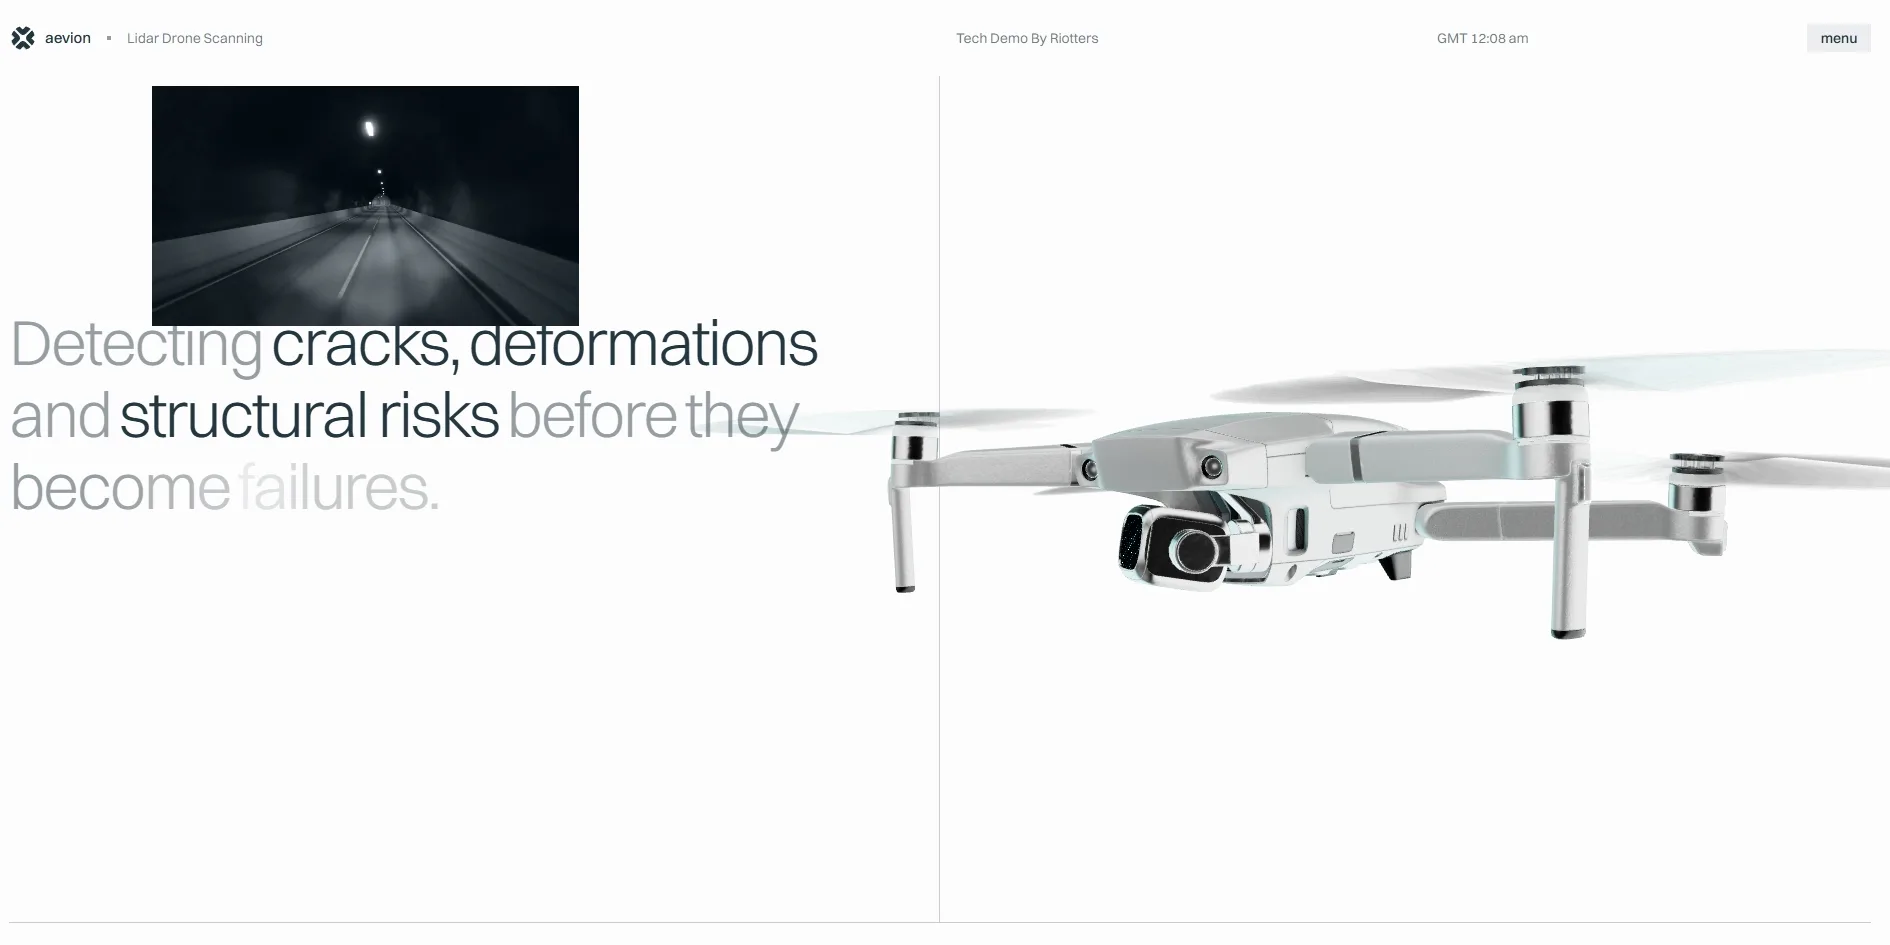
Visitors first see a white screen with a number counting up from 0 in the middle, and once it finishes, a silver-white drone hovers in front of a huge outlined wordmark, aevion. The line below it calls this autonomous LiDAR inspection, precision that secures critical infrastructure. As visitors scroll, a long headline explains what the drone does, detecting cracks, deformations and structural risks before they become failures. A screen with the giant word Gear then introduces its payload, and after that a semicircular gauge lights up three specifications in turn, 5 returns, ±2 cm and 450 m.
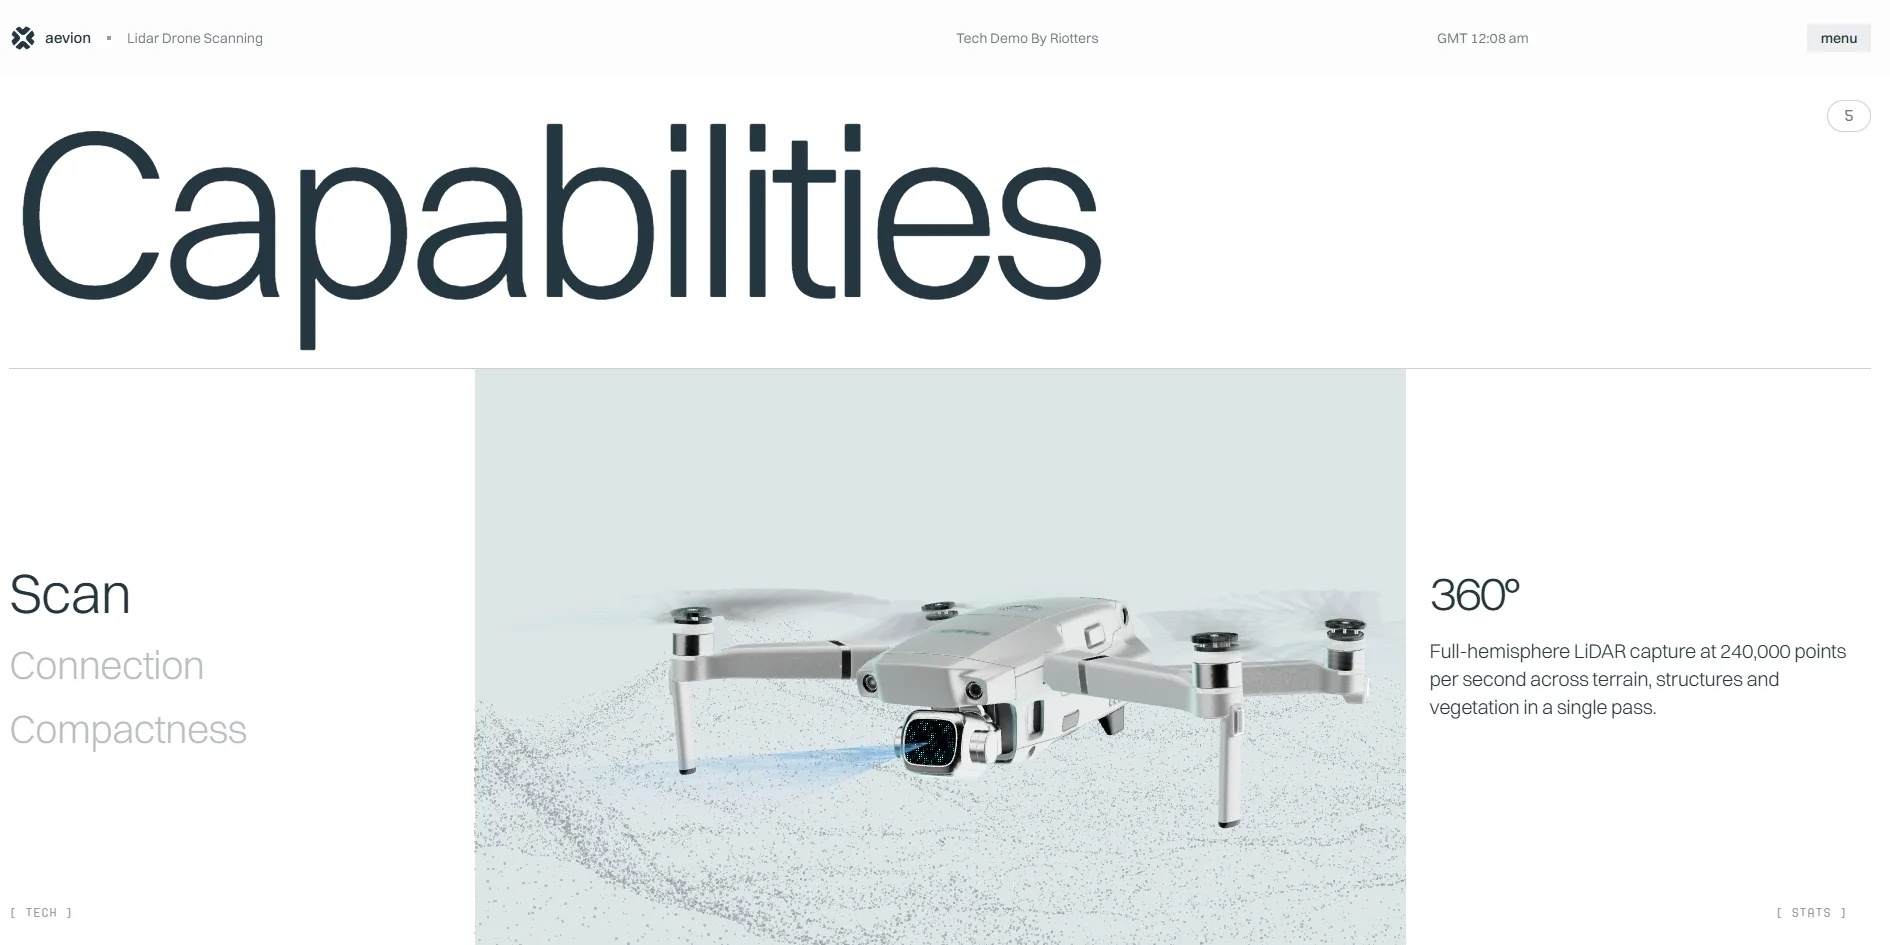
Further down, the page covers uses and capabilities the way product sites usually do. Solutions has four tabs, Energy, Infrastructure, Industry and Geospatial. Clicking one swaps the text on the left and a small spec grid below it for that industry, while the right side switches to a matching aerial video, such as a solar farm for Energy. Capabilities is split into Scan, Connection and Compactness, covering 360-degree scanning, a 7 km encrypted command link and a body that folds down to 42 cm. The final Software section says the processing software turns raw flight data into a deliverable in under 20 minutes, and the terrain map sits below it.
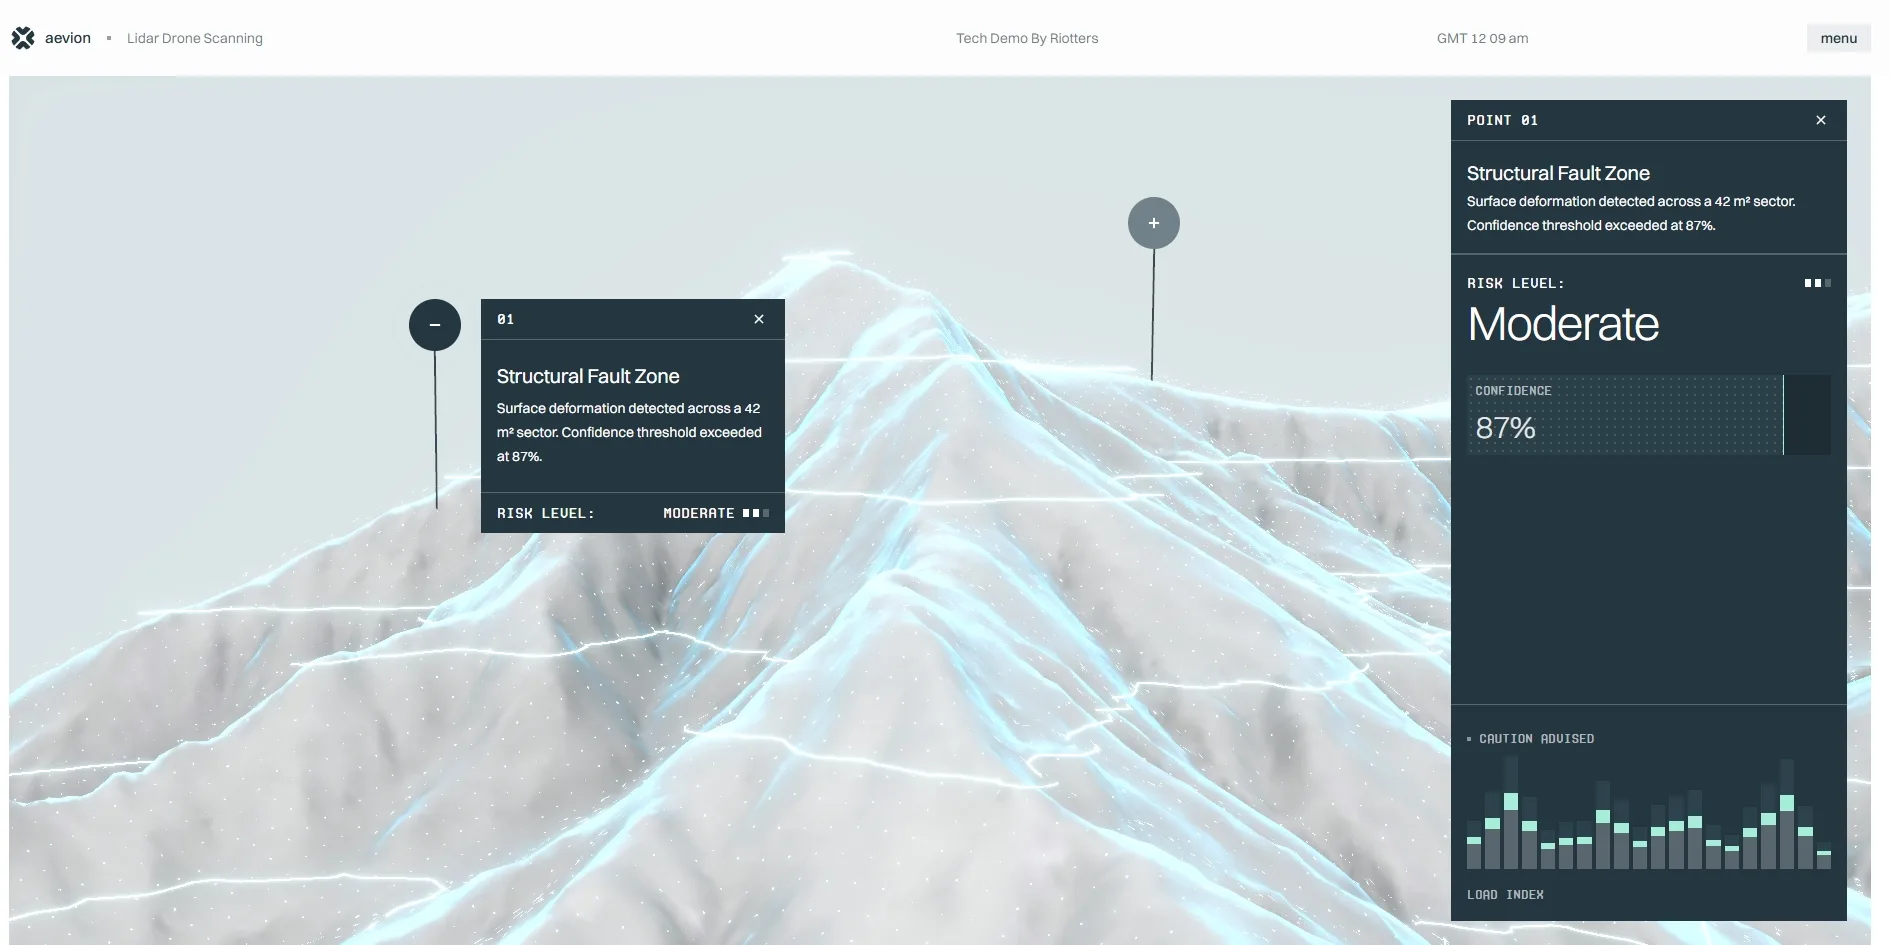
The terrain map is where visitors can most directly dig into the data themselves. Three markers with plus signs stand on it, named Structural Fault Zone, Sediment Drift and Erosion Scarp. When a visitor clicks one, the camera flies towards that point, a small dark card opens next to it and a full panel slides out on the right. For Structural Fault Zone, the panel reports surface deformation detected across a 42 square metre sector, a Moderate risk level and 87% confidence, with a row of bars showing a load index below. These numbers are invented too, but they are laid out like a real inspection report.
02Design
The pictures use almost nothing but white, grey and a near-black slate blue, like a clean industrial product brochure. The background is white and very light grey, the opening screen has a soft gradient from light grey to white, and the body text and headlines are slate blue. The most noticeable cool colour on the page is a pale cyan, which appears in the LiDAR beam, the scan points and the terrain's contour lines, so whenever visitors see that blue they know the page is talking about scanning.
The text works in two layers, one that speaks and one that labels. Headlines and body text use a sans serif, Switzer, and the headlines are set very light, with words such as Gear and Capabilities over ten times the size of the body text and half the width of the screen. Small labels use a monospaced face, Proto Mono, in capitals inside square brackets, such as [ TECH ] and [ MAX RANGE ], like the markings on an instrument panel. The long headline about what the drone does also uses tone for emphasis. The three key words, cracks, deformations and structural risks, are in dark type. The rest is light grey, and the final word, failures, has faded almost to nothing.
Fine lines hold the layout together and give it a sense of measurement throughout. Very thin horizontal and vertical rules divide the sections, specifications sit in a grid of thin-lined boxes and the gauge is a thin semicircle with tick marks. The navigation bar at the top speaks the same way, with the Aevion mark and Lidar Drone Scanning on the left and Tech Demo By Riotters in the middle. On the right runs a clock set to Greenwich Mean Time, its colon blinking with the seconds.
03Motion
The main piece of motion on the site is the 3D drone. It is drawn on a canvas fixed across the whole screen, so when visitors scroll it does not scroll away with the opening screen. It stays in the picture at a new position and angle, moving from the centre of the opening screen to the right of the long headline and then into the Gear and gauge screens. The drone also turns with the cursor, so with the cursor on the left its nose swings left, and with the cursor near the bottom of the screen it turns its front towards the visitor.
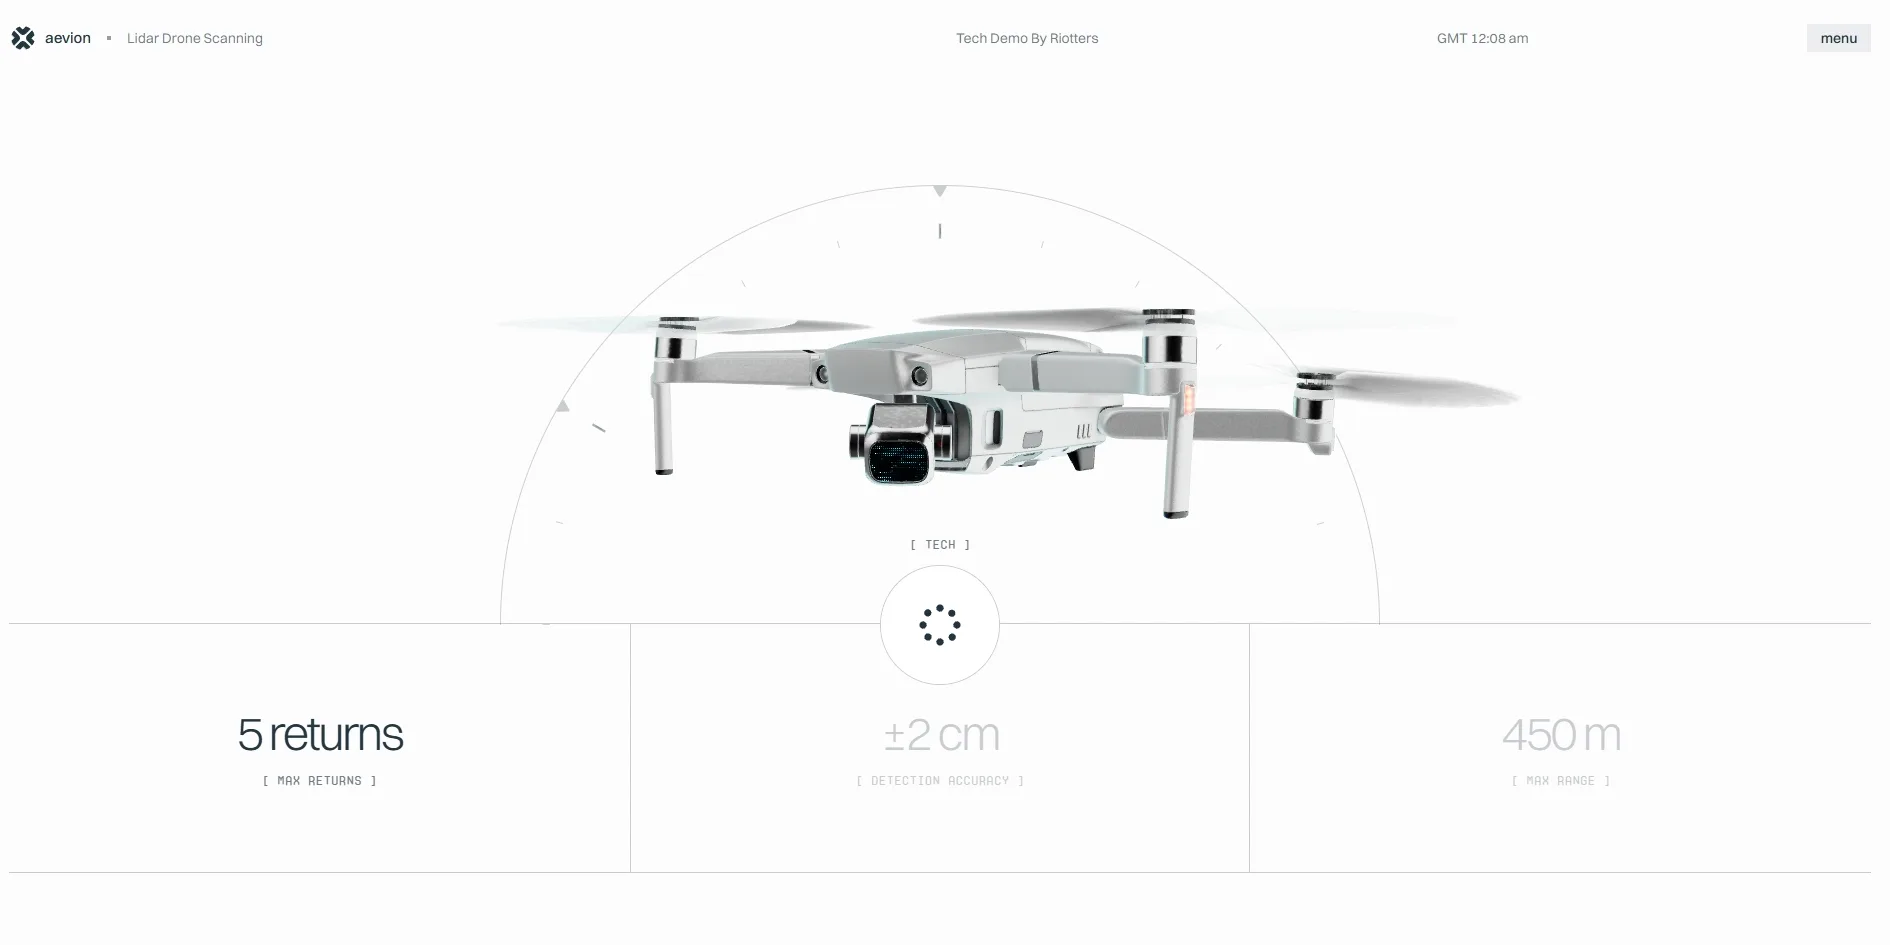
The gauge section uses scrolling to turn through its specifications. As visitors scroll, the section stays fixed on screen and the three specifications go from light grey to dark one after another. A small animated icon made of dots sits in the circle at the base of the semicircle, and it rearranges itself each time the specification changes. Capabilities also holds still, with Scan, Connection and Compactness on the left darkening in turn as visitors scroll and the picture in the middle changing with them. Clicking one of them scrolls the page straight to that item. In the Scan view, the drone's lens sends out a pale blue beam and the ground around it turns into a swirl of scan points.
Besides the drone, the page has a few light interactions. The three key words in the long headline respond to hovering, so with the cursor on cracks a small window opens beside it and plays a matching video, and the window closes as soon as the cursor leaves. The terrain map tilts slightly as the cursor moves, and clicking a marker pushes the camera in. Scrolling is handled by the smooth scrolling library Lenis, so the page keeps gliding a little after the wheel stops.
Two continuous scrolls from top to bottom both held 60 frames per second with no section that dropped frames. With the system setting for reduced motion turned on, scrolling still glides with the same momentum, because the site does not switch off smooth scrolling for that setting.
04Engineering
Riotters built the site with Next.js, the 3D pictures are handled by three.js and the small moving icons by the animation tool Rive. The icons' animation files add up to only about 3 KB, but to play them the site first downloads a Rive player of about 0.8 MB. The footer lists six technologies the site uses, from the front-end framework and the 3D library to content management and hosting.
Opening Aevion's home page downloads about 10 to 13 MB, and video is the largest category. Each of the three key words in the long headline has its own hover video, about 5.3 MB together, and the largest of them, at 3.2 MB, is the largest single file on a first visit. All three videos download as soon as the page opens, yet they only appear when a visitor rests the cursor on those words, so visitors who never hover never see them. The 3D models come to about 6.1 MB, about 3.1 MB for the drone and about 1.5 MB for each of the two terrains. Scrolling to the end downloads a few industry videos as well, for about 16 MB on the whole page.
The first paint arrives between 0.21 and 0.27 seconds, under Google's suggested 1.8 seconds, and what visitors see at that point is the number counting up on the white screen. The full opening screen takes longer, and the drone only appears in full at about the fifth second. At its longest, the page freezes for over 1.5 seconds while loading, but layout shift is 0, so nothing jumps once the page has loaded.
Keyboard-only visitors can mostly get through the site, with only a few small snags. When they press Tab, focus moves through the navigation, the four industry tabs, the three capability items and the three markers on the terrain map, each with a clear black focus ring. The close buttons of the three closed terrain cards are also on the Tab route, though, so focus stops once on each of these three invisible buttons. Neither the menu nor the terrain cards close with the Esc key, only with their close buttons. The page declares English as its language, marks out navigation, main content and footer and offers a link to skip to the content, but it has no top-level heading.
05Scores and Team
| Award | Source | Date | Score |
|---|---|---|---|
| Site of the Day | Awwwards | 2026-10-06 | 7.68 / 10 |
| FWA of the Day | The FWA | 2026-09-07 | 82 POINTS |
The four scores the Awwwards jury gave Lidar Drone Scanning sit close together, highest for Content at 7.93 and lowest for Usability at 7.58. The top content score fits a site that makes an invented product read like a real one, filled out from specifications and industries down to risk reports. A separate panel of developer judges gave 7.34, highest for animations at 8.4 and lowest for markup at only 6.4. The FWA had already given it FWA of the Day on 7 September, and the team's FWA description talks about turning raw drone LiDAR scans into a real-time 3D point cloud rendered live in the browser with WebGL. The scan points visible on the site are mostly in the Scan view, while the terrain map looks like a solid terrain sprinkled with fine dots and traced with glowing contour lines.
| Credit | Who they are | Track record |
|---|---|---|
| Riotters | A design and development studio in Szczecin, Poland, which describes itself as specialising in complex design and branding projects for global scale-ups | Awwwards works 1, SOTD 1, HM 1. FWA 1 |
Riotters' record in the table counts up to the time of writing. This is Riotters' first award-winning piece on either platform, and it was not made for a client. It is a sample the studio made for itself, and what it is really selling is Riotters' own design and development services.
06Archive
- Award date
- 2026-10-06
- Awards
- Awwwards SOTD 2026-10-06, The FWA FOTD 2026-09-07
- Site
- https://drone.riotters.com/
- Credits
- Riotters
- Design
- cinematic
- Build
- scroll
- Awwwards
- 7.68 / 10. Design 7.67 / Usability 7.58 / Creativity 7.71 / Content 7.93. Developer Award 7.34. https://www.awwwards.com/sites/lidar-drone-scanning
- The FWA
- 82 POINTS, DAYS 5. https://thefwa.com/cases/lidar-drone-scanning
- Stack
- Next.js, three.js r183, Lenis, Rive, Draco, Tailwind CSS, Payload CMS, Vercel
- Total assets
- About 10 to 13 MB on a first visit, including about 5.3 MB of hover videos and about 6.1 MB of 3D models, about 16 MB after scrolling to the end
- Speed
- FCP 212–268 ms, drone fully visible at about 5 s, CLS 0. Continuous scroll 60 fps